Following our recent article highlighting the US airports that experienced the highest flight delays during 2023, we now turn our attention to the major US airports where travelers experienced the least disruption to their itineries. As such, this article will focus on the Top 10 US airports with the fewest flight delays in the first half of 2023.
We’ll explore the list in ascending order, unveiling which airports have excelled in maintaining on-time flight schedules this year. Our data has been gathered from the study conducted by the Bureau of Transportation Statistics covering the period of January 2023 to June 2023, titled ‘Airline On-Time Statistics and Delay Causes’. The percentage indicates on-time arrival performance: the higher the percentage, the fewer delays the airport has experienced.
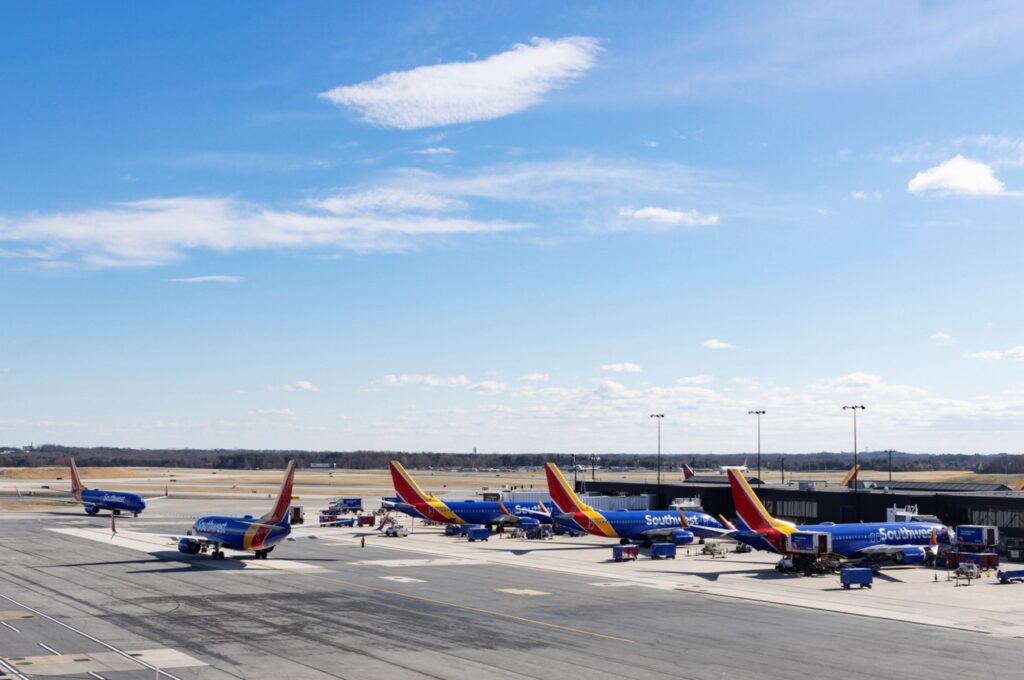
10. Baltimore/Washington International Thurgood Marshall (BWI) – 78.58%
- Location: Baltimore, Maryland.
- Commencement of operations: BWI started up on June 24, 1950.
- Annual travelers: BWI served 22.8 million passengers in 2022.
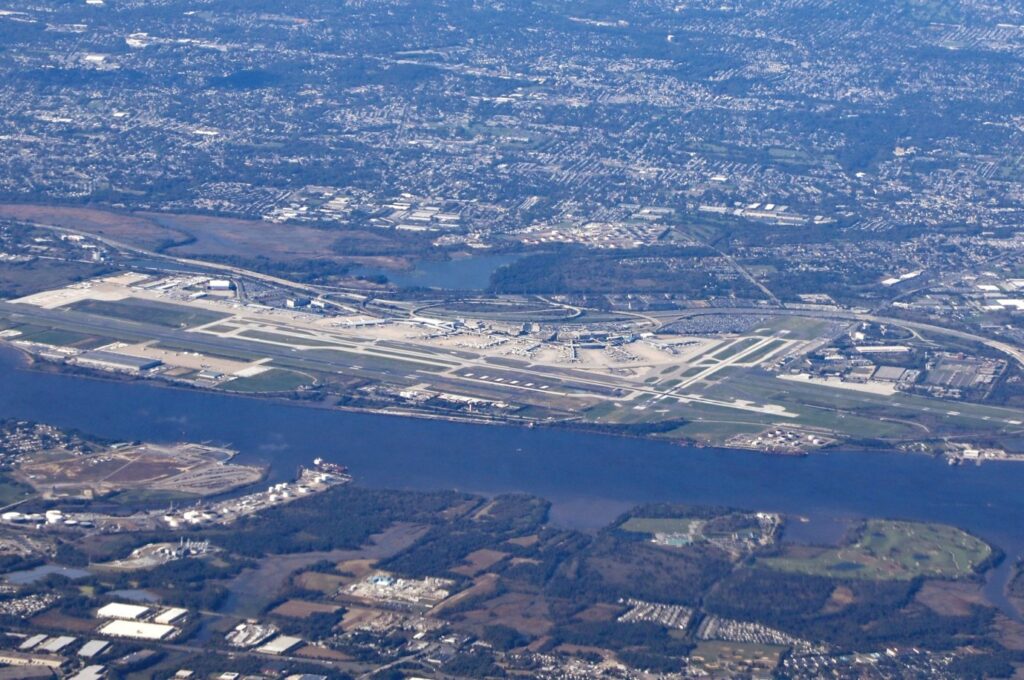
9. Philadelphia International (PHL) – 78.64%
- Location: Philadelphia, Pennsylvania.
- Commencement of operations: PHL started up in 1925.
- Annual travelers: In 2022, PHL served over 25 million passengers.
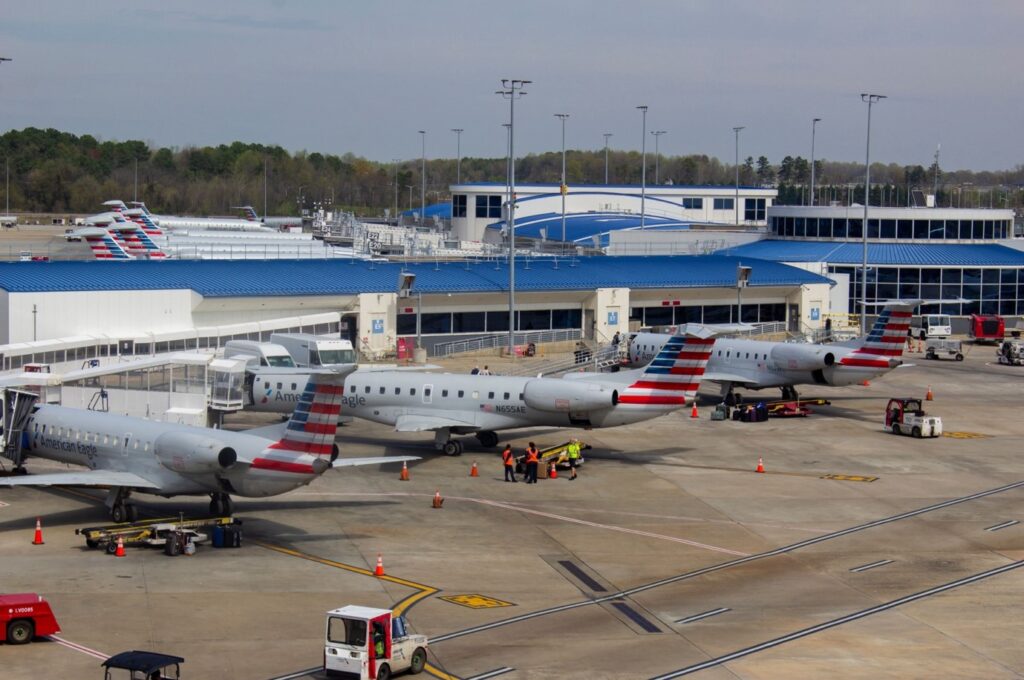
8. Charlotte Douglas International (CLT) – 79.56%
- Location: Charlotte, North Carolina.
- Commencement of operations: 1935.
- Annual travelers: CLT consistently ranks as one of the busiest airports in the US, and it served nearly 48 million passengers in 2022.
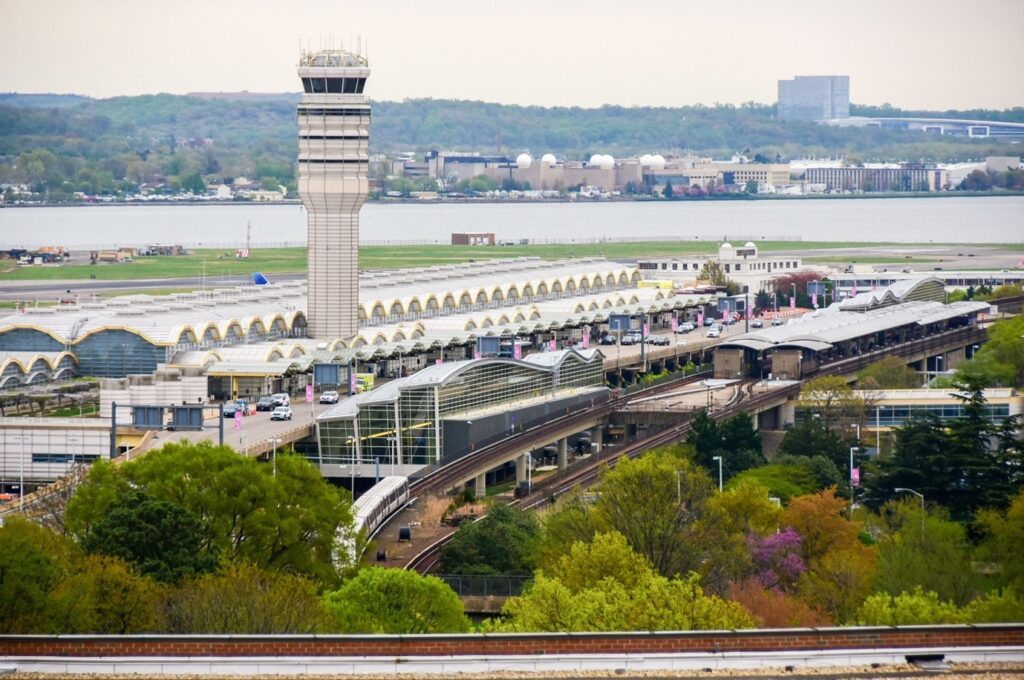
7. Ronald Reagan Washington National (DCA) – 80.13%
- Location: Arlington, Virginia (serving the Washington, D.C. metropolitan area).
- Commencement of operations: June 16, 1941.
- Annual travelers: DCA served over 24.5 million passengers during 2022.
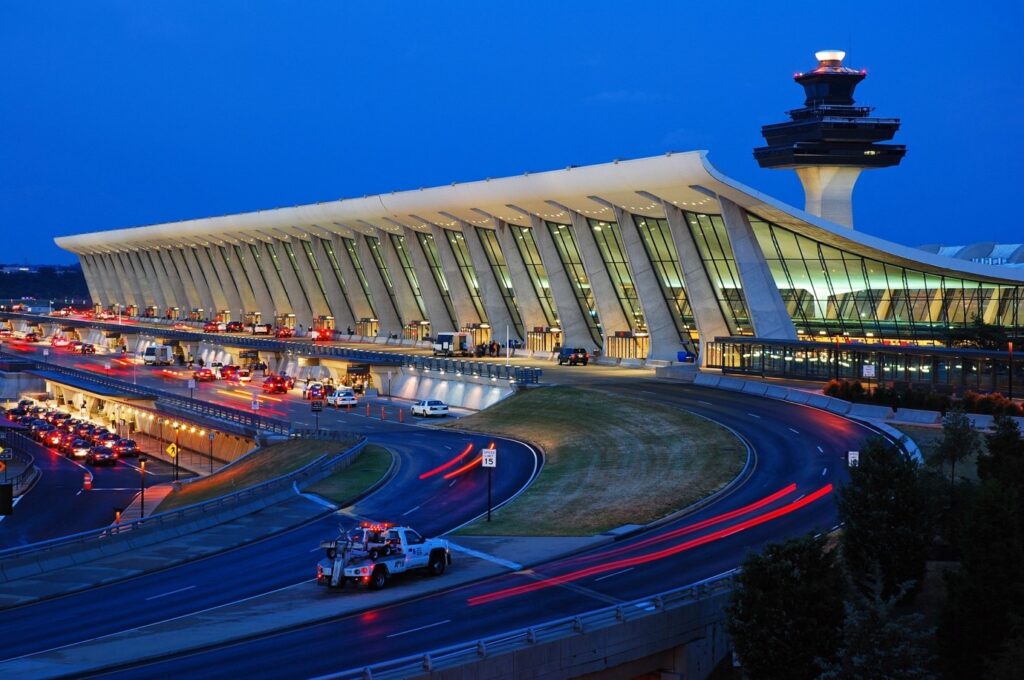
6. Washington Dulles International (IAD) – 80.1%
- Location: Dulles, Virginia (serving the Washington, D.C. metropolitan area).
- Commencement of operations: November 17, 1962.
- Annual travelers: In 2022, IAD served over 21.4 million passengers.
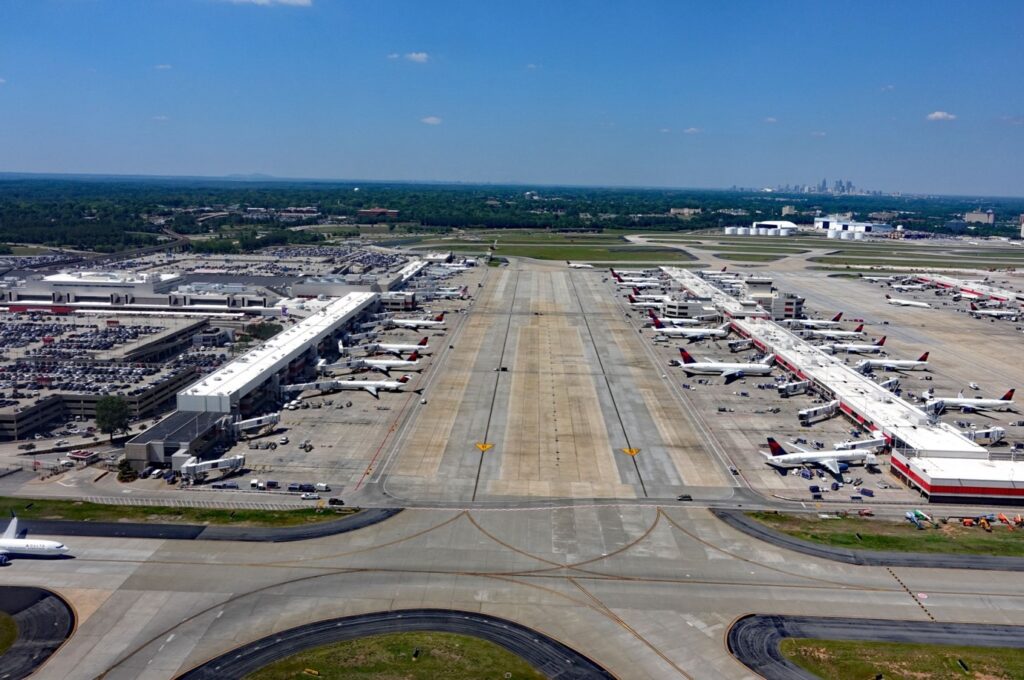
5. Hartsfield-Jackson Atlanta International (ATL) – 80.45%
- Location: Atlanta, Georgia.
- Commencement of operations: September 15, 1926.
- Annual travelers: ATL has the title of the world’s busiest airport, having served over 93 million passengers in 2022.
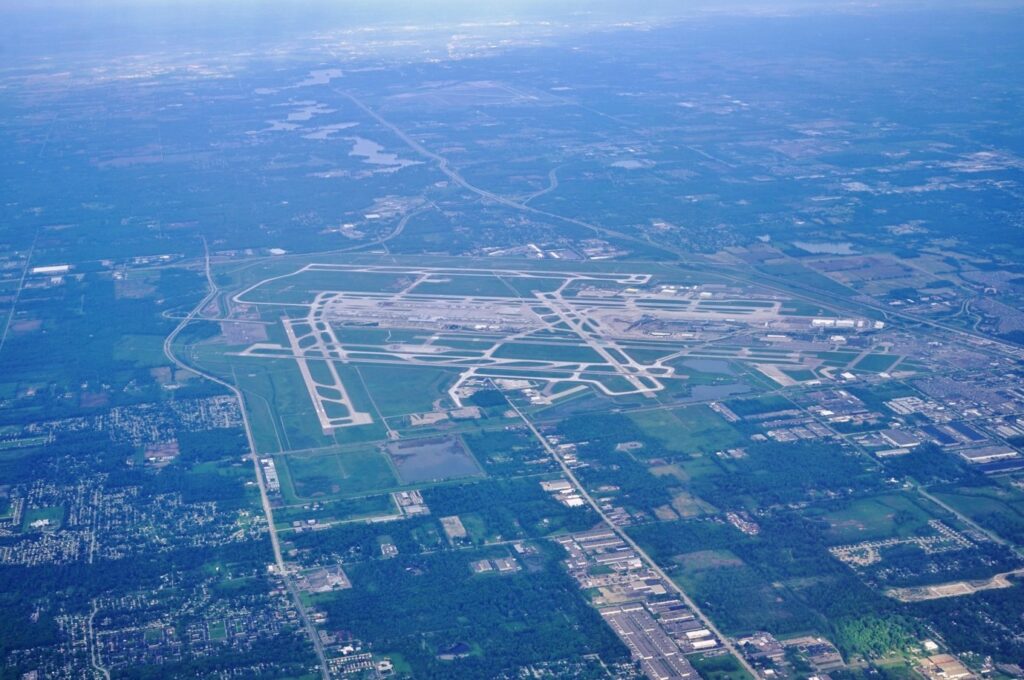
4. Detroit Metro Wayne County (DTW) – 80.97%
- Location: Romulus, Michigan (serving the Detroit metropolitan area).
- Commencement of operations: September 4, 1930.
- Annual travelers: DTW served over 23 million passengers in 2021.
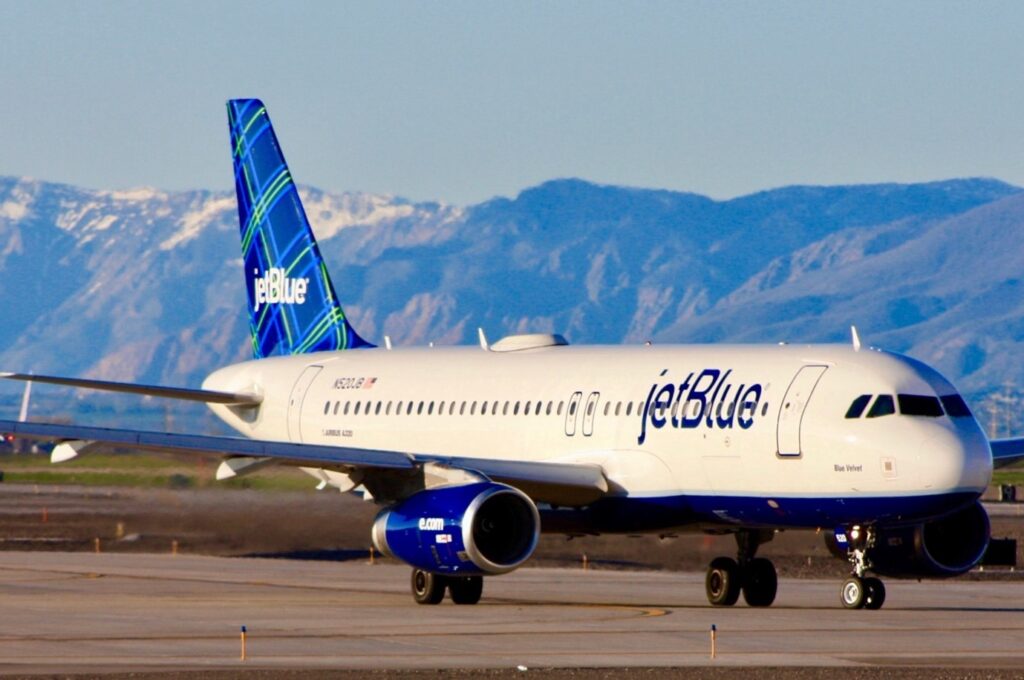
3. Salt Lake City International (SLC) – 81.03%
- Location: Salt Lake City, Utah.
- Commencement of operations: 1911.
- Annual travelers: SLC served over 26 million passengers between July 2022 and June 2023.
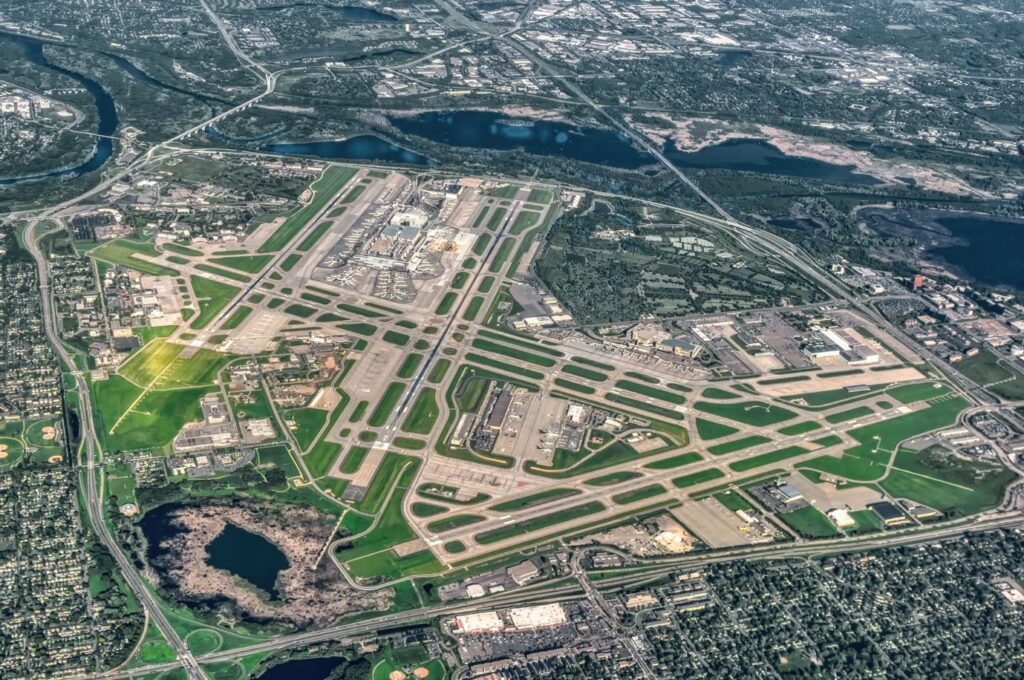
2. Minneapolis-St Paul International (MSP) – 81.96%
- Location: Minneapolis, Minnesota.
- Commencement of operations: July 10, 1920.
- Annual travelers: MSP served over 31 million passengers in 2022.
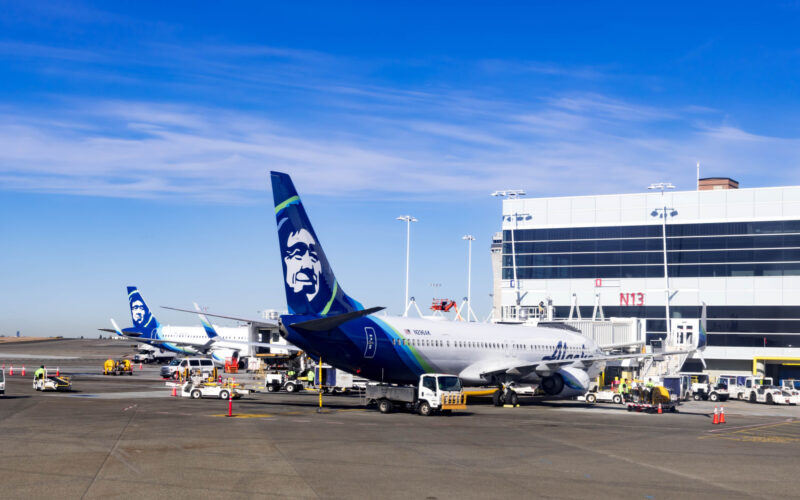
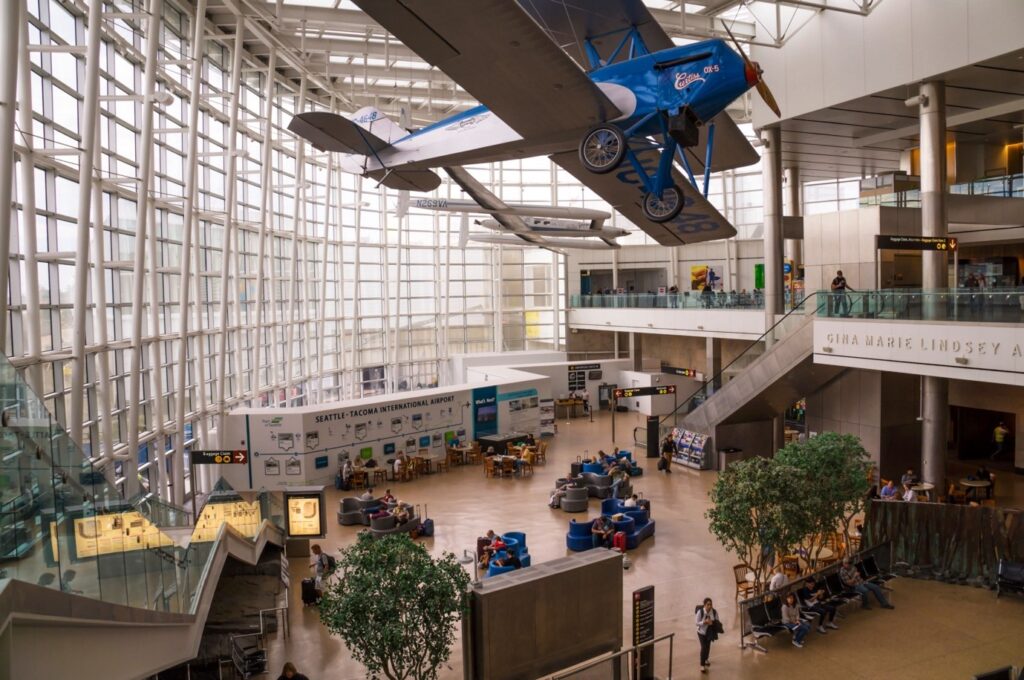
Top 1. Seattle/Tacoma International (SEA) – 82.54%
- Location: Seattle, Washington.
- Commencement of operations: 1944.
- Annual travelers: SEA served 45.9 million passengers in 2022.
Also, for the second consecutive year, Seattle-Tacoma International Airport has retained its title as the best airport in North America.
To sum up: Top 10 US airports with the fewest flight delays in the first half of 2023
| Rank | Airport | On-time Arrival Percentage |
| 10 | Baltimore/Washington International Thurgood Marshall (BWI) | 78.58% |
| 9 | Philadelphia International (PHL) | 78.64% |
| 8 | Charlotte Douglas International (CLT) | 79.56% |
| 7 | Ronald Reagan Washington National (DCA) | 80.13% |
| 6 | Washington Dulles International (IAD) | 80.1% |
| 5 | Hartsfield-Jackson Atlanta International (ATL) | 80.45% |
| 4 | Detroit Metro Wayne County (DTW) | 80.97% |
| 3 | Salt Lake City International (SLC) | 81.03% |
| 2 | Minneapolis-St Paul International (MSP) | 81.96% |
| 1 | Seattle/Tacoma International (SEA) | 82.54% |

